
NBPP 2027 - Analysis and Implications
Part 1: Cost Sharing Reductions

On Friday, CMS finalized the Notice of Benefit and Payment Parameters for 2027. Over the next few weeks, my team and I will be breaking down some of the key changes (and key things that won’t change) that we think are important.
We’re still planning this series, but at minimum, we’ll be looking at:
Non-network plans
Multi-year catastrophic plans
State-based exchange program integrity
The end of standardized plans
Risk adjustment
Bronze plan design flexibilities
The SBE-EDE model
If there’s an area you want us to cover that’s not here, drop a comment or email.
Cost-Sharing Reductions
Today, though, I wanted to start by unpacking a change that doesn’t seem all that important (requiring some additional fields in the rate review templates), but could actually be the most significant change of all. It involves cost-sharing reductions (CSRs). Last year, I wrote a blog post explaining what CSRs are when CMS first asked for this kind of information in the PY 2026 rate filings. If you haven’t read that post, it’s worth a read, but I’ll summarize quickly here for everyone else.
CSRs are a second ACA subsidy, separate from premium tax credits, that lower deductibles, copays, and out-of-pocket maximums for enrollees under 250% of the federal poverty level who buy a silver plan on-exchange.1
The intended structure of the ACA as written requires the carrier to price a silver plan at silver-level benefits, but the actual plan an eligible enrollee gets has more generous cost-sharing. For example, a 94% actuarial value plan might have a $0 deductible and a $2,000 out-of-pocket maximum instead of the $5,000 deductible and $8,000 MOOP on the underlying “base” silver plan. From 2014 through September 2017, the federal government paid the carrier for the difference between what the member would have paid under the base silver plan and what they actually paid under the more generous CSR variant - but CSRs were never directly appropriated by Congress, and the House sued the Obama administration to stop the payments. In October 2017, President Trump sided with the House and ended CSR funding - but the obligation of insurance carriers to provide the plans with more generous cost sharing remained - so carriers had to raise premiums to compensate for it.
Most carriers responded by raising silver premiums to recoup that lost reimbursement: a practice commonly called “silver loading,” typically in the 20–40% range. A few states mandate the load (Texas, for example, requires 40% across the board); others leave it to the carrier or require it to be loaded across all plans rather than just silver plans. The mechanics produce a strange but useful side effect: because premium tax credits are benchmarked against the second-lowest-cost silver plan, raising silver premiums increases the APTC subsidy for everyone, and in many markets, that’s how bronze plans became free and gold plans became cheaper than silver for subsidy-eligible buyers.
This is the paradox here that Axene and others have written about more fully: defunding CSR ended up costing the federal government more than funding it would have. Higher silver premiums produced higher APTCs, which more than offset the savings from not paying CSR reimbursements directly. The 2017 decision was a coverage expansion even though it was viewed as a cut by many at the time (Trump referred to the CSR payments as “bailouts” that he was ending - but if the goal was to reduce funds flows to insurers, cutting CSR reimbursements did the opposite). Issuers, brokers, and state regulators have made their peace with the strange equilibrium it produced. Plans price for it; consumers (with the help of brokers who know what they’re doing) navigate it; state insurance departments accommodate it.
Now, NBPP 2027 is requiring carriers to provide specific details about the costs of CSRs and CSR loads, but the commentary from CMS on why they’re asking for this info should give every stakeholder pause, because what CMS, state regulators, and legislators do with this information could end up radically reshaping the ACA market.
What NBPP 2027 is Actually Doing
The change is seemingly small. CMS finalized a proposal to add a few line items to the Unified Rate Review Template; specifically, Worksheet 2, Section II now requires issuers to report, for both the experience period and the projection period: Federal CSR Payments (which will be $0 unless Congress acts to re-fund CSR), Issuer CSR Payments (the amount the issuer paid out under the CSR variants, net of any state-based subsidies), and Recoveries from CSR Load (the additional premium revenue collected through the silver load).
The recovery math is straightforward: take the loaded silver premium, divide it by silver load factor to back out what the unloaded premium would have been, and the difference between the two is the recovery. For a Texas silver plan generating $100M in total premium, that’s $100M − ($100M / 1.4) = about $28.6M, or roughly 29% of post-load silver premium. For a more typical 1.2 load, it’s about 17%. The actuarial memorandum that accompanies the template has to provide “a detailed explanation that compares these amounts and demonstrates that the CSR load factor is calibrated on actual experience and accounts only for the projected revenue loss of unreimbursed CSR payments without materially exceeding that amount.”
Seems simple enough: fill in some new template fields, write a paragraph in the actuarial memo defending your load. Some people will read this and conclude it’s a disclosure tweak: annoying, requires some plumbing changes to your rate-filing process, but not a fundamental shift. I think the operational framing understates the actual change. Two things are worth emphasizing:
One: the methodology became mandatory. The “actual experience” the actuarial memo has to be calibrated on is, per CMS, the value of CSRs actually paid to each enrollee, computed under the standard methodology described at 45 CFR 156.430(c)(2). For PY 2026, CMS gave issuers flexibility: a May 2025 FAQ allowed estimates “developed using a reasonable methodology” if the actuals weren’t computable in time. For PY 2027, that flexibility is gone. The rule’s response to commenters (like me) who requested a safe harbor was emphatic: “we recognize that some updates to issuers’ systems will be necessary, but we do not agree that a delayed applicability date is warranted… we believe that issuers should already be calculating the actual CSRs paid for enrollees.”2
I’ll come back to what doing this work actually entails. For now: the standard methodology is re-adjudication. You take every claim the enrollee filed in the CSR variant, you adjudicate it under the standard (base) silver plan’s cost-sharing logic, and you compute the difference. That difference, summed across every claim and every enrollee, is the actual CSR amount. There’s no shortcut; CMS points you to the BY2017 CSR Reconciliation Manual for the methodology.
Two: CMS gave itself three enforcement mechanisms. The URR Instructions language about “calibrated on actual experience and accounts only for the projected revenue loss of unreimbursed CSR payments without materially exceeding that amount” is the affirmative defense an issuer’s load needs in order to survive federal challenge. CMS spelled out three discretionary mechanisms in the rule’s preamble for what happens if the defense doesn’t hold up, with each pointed at a different consequence:
The first is §154.205(b), in non-Effective-Rate-Review states: CMS can determine that a rate increase is “unreasonable” if the CSR load is developed under a methodology that does not reasonably account for projected unpaid CSRs. The framing of this in the final rule preamble makes it sound alarming, but on its own this is mostly reputational. Under §§154.225 and 154.230, an “unreasonable” determination obligates the issuer to post CMS’s determination on its own website for three years, alongside a Final Justification, but it does not prevent the issuer from implementing the rate. The issuer can still charge the rate; they just have to post the federal nastygram while doing it. I don’t think consumers will know or care; they likely already think that their health insurance company is charging unreasonable rates and I doubt knowing the federal government agrees would change many shoppers’ minds.
The second is §154.301(d). If a state with an Effective Rate Review Program declines to deem an aggressive CSR load “unreasonable” when CMS thinks it should, CMS can re-evaluate whether the state still has an ERR program. Lose ERR status and all rate filings in the state shift to CMS review, and the political dynamic between the state DOI and its regulated issuers shifts materially.
The third is §155.1000: denial of QHP certification on the FFE. CMS asserts the authority to deny certification for “CSR loading practices that result in premiums that are significantly higher than would reasonably be expected when accounting for the amount of unreimbursed CSRs.” Translating “CSR load too high” into “not in the interest of qualified individuals” under §155.1000’s existing certification framework would be an aggressive regulatory move, but the threat is real and CMS could certainly make things difficult for an issuer if they wanted to.
Realistically, I don’t think either of the last two is particularly likely to actually be deployed. Both would invite litigation (more so in a world without Chevron deference), both would impose collateral damage on enrollees who have nothing to do with the underlying rate-review dispute, and both have political costs without a particularly clear winner. But CMS doesn’t need to deploy §154.301(d) or §155.1000 to get an issuer or a state DOI to reconsider an aggressive load; the threat of deployment, backed by published URRT data showing the load comparison, is probably enough for CMS to shape the policy outcome they’re after. Exactly what the desired outcome for CMS is, though, is unclear.
That leaves two related questions: what does CMS do with the URRT data once it has it, and what does an individual issuer do to make sure their own load survives the scrutiny. I’ll take these in turn.
Market Risks: Texas, the NAIC, and Whether Congress Cares
The first-order market question is what happens in states that mandate the silver load. Texas requires 40% across the board. New Mexico mandates a particular methodology. Florida started mandating a CSR load in 2026. California’s regulatory regime is its own ecosystem.
The Texas situation is the obvious tension point. A federal mandate that CSR loads must be “calibrated on actual experience and accounts only for the projected revenue loss” would seem to generate a clear conflict with a state mandate of 40% applied uniformly across all silver plans regardless of issuer-specific experience. If Texas issuers’ actual CSR amounts come in materially below 40% of premium (and I suspect they will, given that 40% is a regulatory choice rather than an actuarial calibration, and a fairly high one at that), CMS’s enforcement framework gives them ammunition to challenge the loads, and §154.301(d) gives CMS a lever to pressure the Texas Department of Insurance directly. States that have not expanded Medicaid (all of which are states where their government is dominated by Republicans) have the most at stake here, because the percentage of individuals in the 94% AV CSR plans is much higher in non-expansion states.
Just how much higher? Using the 2026 OEP silver plan selections from the CMS state-level public use file we can look at how enrollment is distributed among silver plans and do a back of the envelope calculation. 3 In the ten non-expansion states, 83.9% of silver enrollees are at 100–150% FPL (the 94 AV variant) and another 11.2% are at 150–200% FPL (87 AV). In the 40 expansion states plus DC, only 40.3% are at 100–150% FPL with 29.0% at 150–200%.4 This wildly different distribution in non-expansion states is exactly what you’d expect: the 100-138% FPL population that would be in Medicaid in an expansion state ends up in the marketplace in a non-expansion state, where they qualify for the deepest CSR.
What does that imply for the “right” silver load? If we assume the AV calculator is roughly accurate, so providing 94% AV instead of the 70% AV base costs the issuer about 34% more in claims dollars (94%/70% -1), 87 AV costs about 24% (87%/70% -1), and 73 AV costs about 4% (73%/70% -1). Using that math, the load that recovers the actual unreimbursed CSR amounts (and nothing more) works out to:
Non-expansion states: 0.839 × 34.3% + 0.112 × 24.3% + 0.017 × 4.3% ≈ 31.6% of silver premium
Expansion states + DC: 0.403 × 34.3% + 0.290 × 24.3% + 0.099 × 4.3% ≈ 21.3% of silver premium
So a “true” load is about **10 percentage points higher** in non-expansion states than in expansion states. Texas’s mandated 1.4 load (40% of premium) is above this back-of-the-envelope level even with one of the highest 94-AV-eligible concentrations in the country: 88% of Texas silver enrollees are at ≤150% FPL, and the implied load on that mix is about 33%. The other non-expansion states run similar implied loads — Florida (87% at ≤150% FPL, implied load ~33%), Georgia (78% at ≤150% FPL, implied load ~30%), Mississippi (82%, implied load ~31%), South Carolina (81%, implied load ~31%), Alabama (75%, implied load ~29%). The big expansion-state SBEs run considerably lower: California (24% of silver at ≤150% FPL, implied load ~18%), New Jersey (31% at ≤150% FPL, implied load ~17%), Massachusetts (15% at ≤150% FPL, implied load ~12%). Texas’s 40% mandate is roughly 7 points above its implied level: not an enormous gap, but if CMS takes the “without materially exceeding that amount” standard at face value, it will invite some scrutiny.5
I don’t pretend to have any meaningful read on the political dynamics here, and one thing that stands out is that this would be the Trump administration picking a public fight with Texas and other Republican-led states over rate-setting authority. The administration’s instincts have not typically pointed in the direction of preempting state insurance regulators, especially Republican state insurance regulators. The Texas Department of Insurance has historically defended its regulatory authority vigorously, and the NAIC has already signaled in language that’s polite for the NAIC, but not subtle that CMS should leave the states alone and not preempt state responsibility for rate review. I’d be surprised if §154.301(d) gets invoked against Texas, even if the data CMS collects under the new URRT line items would arguably support it.
So what’s the play? Greg Fann, who has been writing about this regulatory space with more attention than most,6 suggested last week that the most likely outcome is a kind of slow-motion confrontation: most states ignore the rule this year, CMS pushes a little harder in 2028, and somewhere along the way the structural mess produces enough pressure that Congress is motivated to appropriate CSR funding.
I suspect he may be right, and it may be a feature of how the data collection is designed. If CMS publishes URRT-based comparisons between aggregate silver-load recoveries and aggregate reconciled CSR amounts across the market, the implicit message is: here is how much “extra” revenue is flowing through the silver-loading workaround, and here is how much it would cost the federal government to fund CSR directly instead. Even if they don’t publish a specific comparison, presumably this will be a reportable field in the URRT PUFs, so anyone can easily see what’s going on once those come out later this year.
The numbers, even at the rough order of magnitude, are real money. CBO and JCT scored appropriating CSR through Section 44202 of last year’s House-passed reconciliation bill (H.R. 1, the “One Big Beautiful Bill Act”) at roughly $31 billion in deficit reduction over 2025–2034: about $30.8 billion in APTC outlay reductions plus $2.8 billion in revenue increases, partially offset by the direct CSR appropriation itself. CRFB has argued that if CSR appropriation were extended to all states (rather than the more limited H.R. 1 scope), savings could exceed $50 billion. For historical context, the original August 2017 CBO score of ending CSR payments was a $194 billion deficit increase over a decade. Regardless of what the number actually is, it’s big, and for a Senate majority looking for budget reconciliation offsets, appropriating CSR is a deficit-reducing line item that could provide some pay-fors for other policy preferences.
The alternative path is the one where CMS uses these tools tactically: picking a few high-load issuers, leaning on a few state DOIs, and producing a slow downward pressure on loads through the threat of enforcement without ever quite invoking it. That works to reduce APTC outlay without requiring congressional action. It also produces meaningful harm to issuers (and their customers) whose loads are actuarially justified by their underlying risk mix but who can’t produce the documentation to prove it. Which brings me to the second-order question.
Issuer-Level Risks: A More Complicated Load Than It Looks
How an issuer sets their CSR load under the new rules depends on what assumption they make about the population that’s going to enroll. CMS was somewhat accommodating on this: in response to comments (including ours) about the risk of forcing every issuer into a plan-specific calculation, the final rule clarified that issuer/plan-level matching is not required, and that “it may be appropriate to consider CSR enrollment across the entire market rather than only considering the specific enrollment of one particular issuer.” For most carriers, the path of least resistance is to do exactly that: project the load against a market-level CSR enrollment and utilization profile, set the load factor accordingly, file the actuarial memo pointing at the market data, and move on.
The complication is that the market projection produces a single load number, and the actual CSR exposure isn’t a single number for the carriers it most matters for. For an issuer whose CSR-eligible enrollment is sicker than the market average, the actual unreimbursed CSR amount they’re recovering on their own premium runs above whatever the market-level projection would imply. They have a choice: file at the market-implied load and absorb the shortfall, or file at a higher load and make an issuer-specific actuarial case for the deviation. Doing the second requires the actuals work.
Whether the market-implied load is meaningfully different from your own actual exposure depends on the composition of your CSR-eligible book, and the 94 AV plan, where most of the CSR-eligible enrollment lives (at least in states which did not expand Medicaid), has an unusual composition. We’ve been doing some work in the EDGE Limited Data Set (a deidentified dataset with claims data for all ACA enrollees in 2022 and 2023) this spring breaking down enrollees by utilization status and modeling the resulting issuer-level economics.
Before getting into the numbers, one piece of jargon worth explaining. HCCs: Hierarchical Condition Categories are the building blocks of the HHS-HCC risk adjustment model that powers ACA risk transfers. CMS maps roughly 100 chronic and acute diagnoses (HIV, diabetes, certain cancers, congestive heart failure, kidney disease, and so on) to specific risk-score weights. A member who triggers at least one HCC ends up with a higher risk score than a member who doesn’t, and the risk-transfer formula flows money toward issuers whose members have higher average risk scores, funded by issuers whose members have lower ones. The analysis that follows segments enrollees into three groups: non-utilizers (zero claims for the year), no-HCC utilizers (had claims but none of the diagnoses that trigger an HCC), and HCC-positive utilizers (had claims and triggered at least one HCC). HCC-positive members are the ones the model expects to be costly and is designed to compensate the issuer for carrying.
The 2023 picture:
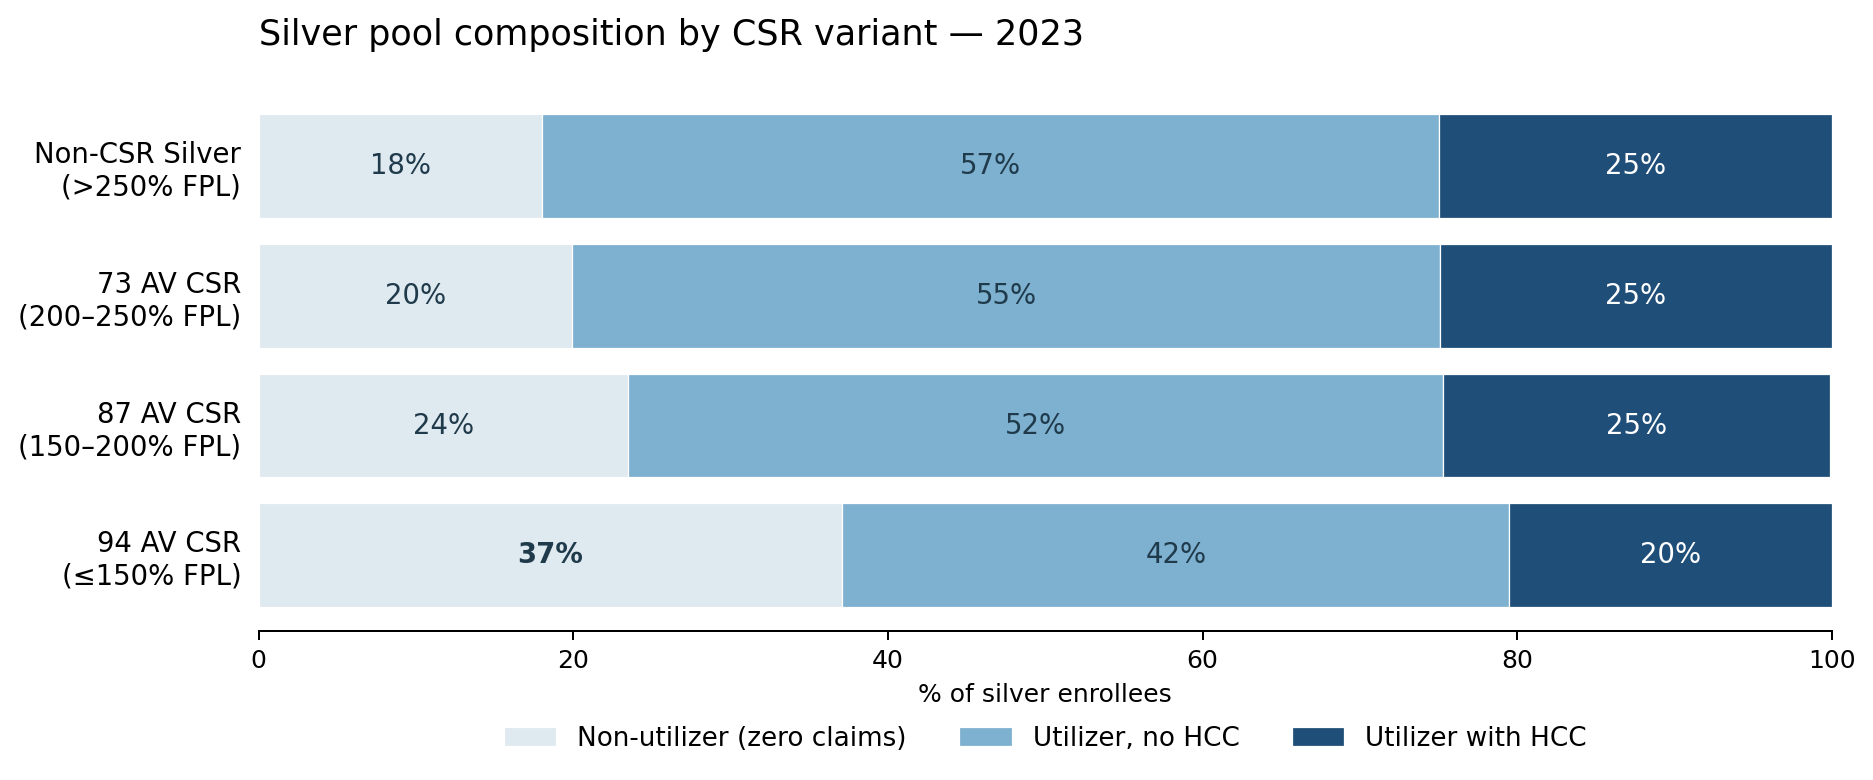
As you’d expect, the 94 AV segment has a very different distribution than other silver members. 37% of 94 AV members had zero claims of any kind in 2023, another 42% utilized at modest cost without any HCC, and only 20% were HCC-positive utilizers. That 37% non-utilizer share is roughly 2× the non-utilizer rate in non-CSR silver (18%) and well above 87 AV (24%) or 73 AV (20%). The high non-utilizer rate is not unique to silver: on-Exchange Bronze runs even higher at 39%, probably driven by the same free / near-free-premium dynamics. What distinguishes 94 AV is that each of those non-utilizers is paying silver-loaded premium: 20 to 40% above what an “unloaded” plan would charge.
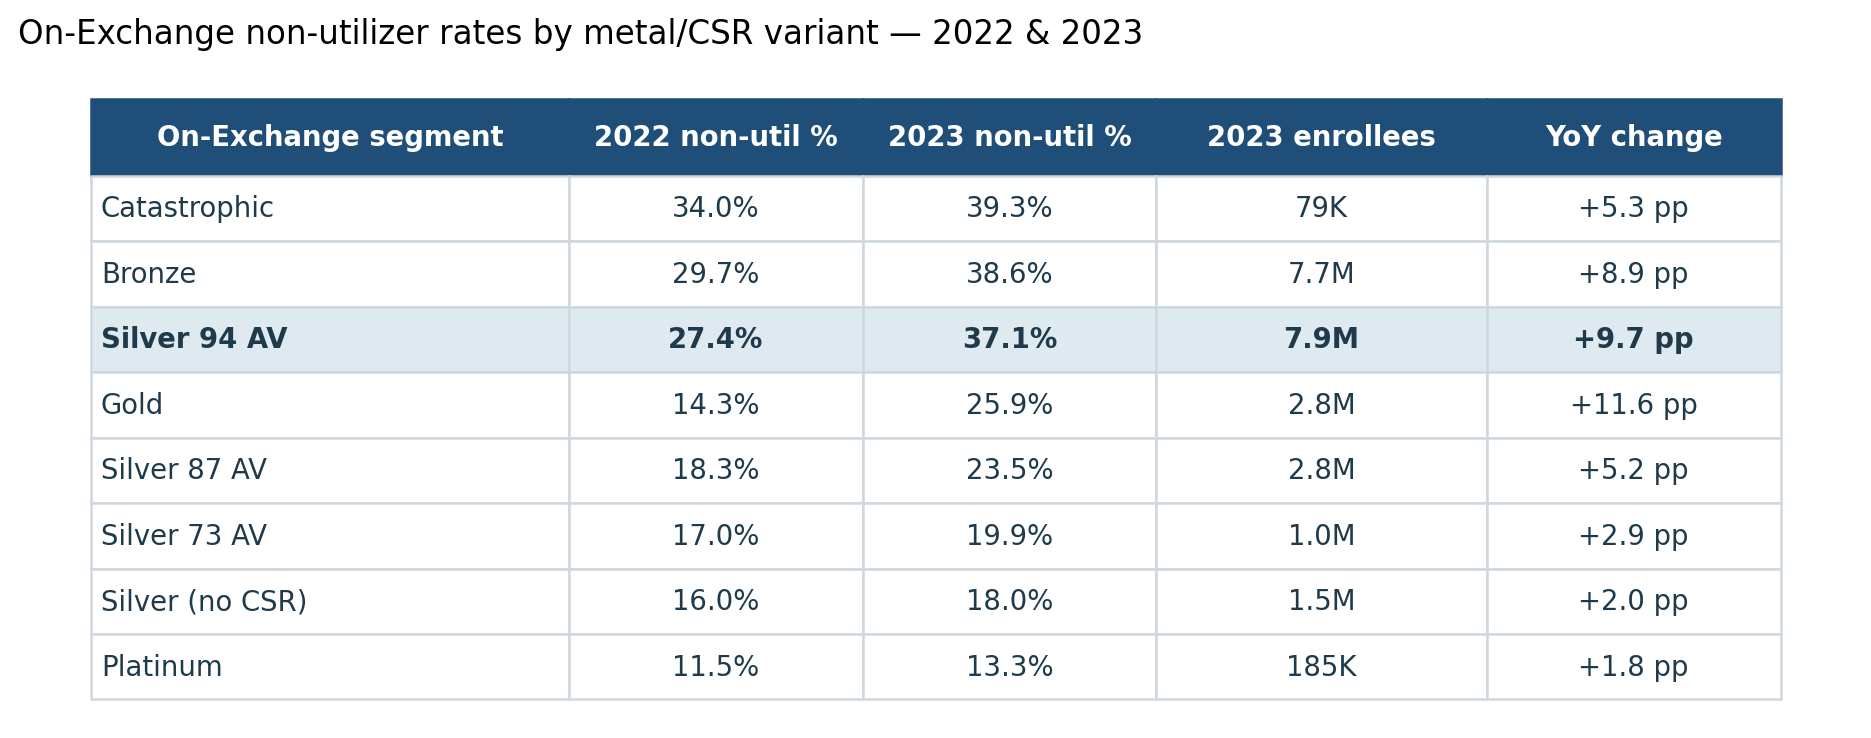
Bronze and Silver 94 AV together account for 15.6M of the market’s 24.2M on-Exchange members, and both run non-utilizer rates near 40%.7 The carrier that captures the healthy end of either pool captures both the volume and the margin, but only the Silver 94 AV pool generates silver-loaded premium on those non-utilizers.
2023 was an unusual year: the Medicaid-unwinding wave pushed a lot of new enrollees onto the marketplace, and new enrollees had disproportionately low utilization. But the pattern isn’t just a 2023 artifact. In 2022, before the unwinding hit, 94 AV non-utilizers were already 27% of this population: 1.7× the non-CSR Silver rate and 2.5× off-Exchange. The unwinding wave compounded an underlying structural pattern; it didn’t create it.
That structural pattern produces real money. Using the same EDGE LDS data, we modeled segment-level economics for the 94% AV segment using a silver-loaded premium proxy from the 2024/2025 URRTs and a proxy risk-transfer formula calibrated to national averages.8 Under this approach, net margin per member-year breaks out as:
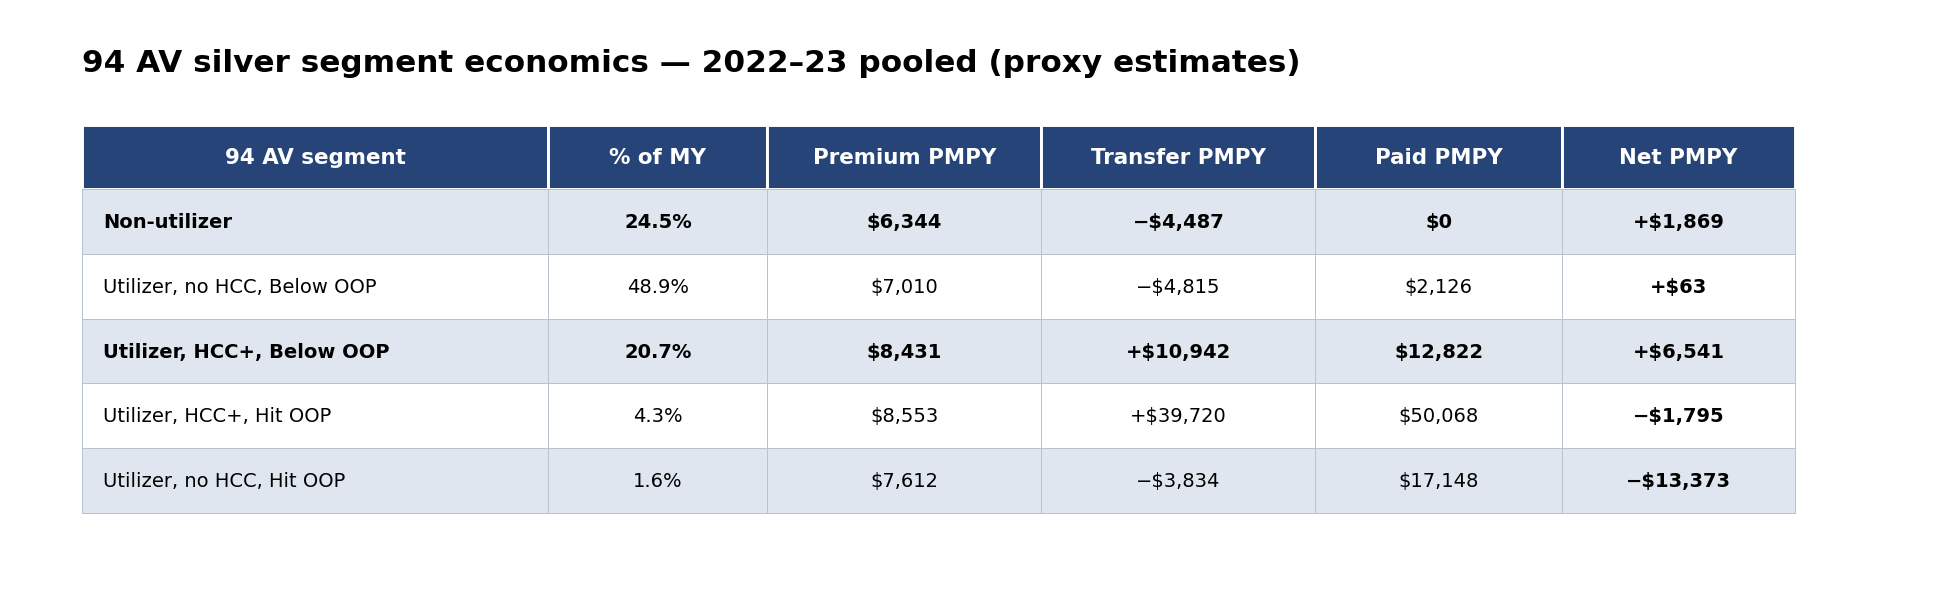
In aggregate 94 AV silver pool generated roughly $1,869 of gross margin per member-year over 2022–23 (pre-administrative expense, pre-tax, pre-MLR rebate); this is about 36% more than the $1,138/MY produced by on-Exchange non-CSR Silver, driven mainly by 94 AV's much higher non-utilizer share. Within 94 AV, the Hit-OOP tail (~6% of member-years) is the loss-making segment: HCC+ Hit-OOP runs about a $1,800 loss per MY (risk transfer compensates for some, but not all of the higher cost claims) and no-HCC Hit-OOP is the more severe −$13,373 per MY (a smaller group of otherwise-healthy people who had an expensive year the risk adjustment model doesn’t compensate for).
For context, here’s how the same proxy methodology lays out across the rest of the on-Exchange individual market pool over 2022–23:
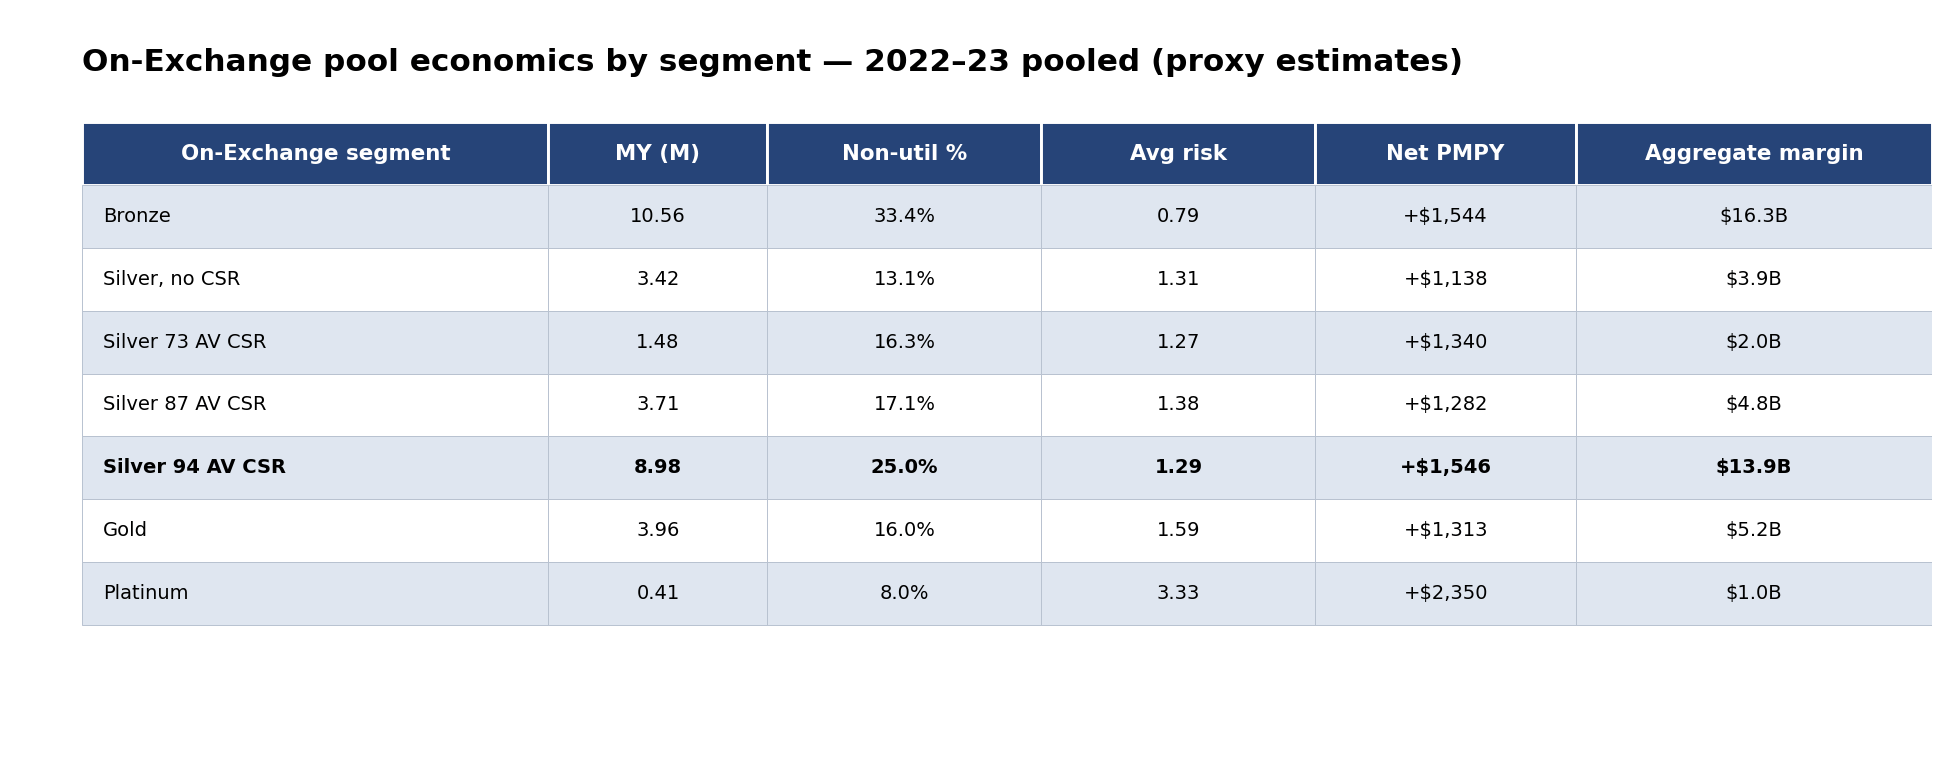
The 94 AV advantage isn’t that non-utilizers are unusually profitable on a per-member basis: they’re about the same in other metal levels. It’s that the 94 AV segment has more of its member-year base in the non-utilizer segment, plus stronger transfer compensation in the HCC+ Below-OOP segment that more than offsets the higher paid claims.
However, it’s important to note that this margin is the aggregate. The actual economics vary materially across issuers because each issuer’s 94 AV composition differs from the market mix: how much of their 94 AV book sits in the non-utilizer segment versus the HCC+ segments, how exposed they are to the Hit-OOP tail, whether their network or some other characteristic of their plan tends to attract the non-utilizers. For an issuer whose 94 AV enrollment is healthier than the market, more of the pool margin accrues to them: more non-utilizer member-years at the higher margin, fewer Hit-OOP losses.9 And the carrier that attracts the low-risk segment captures both the profit and the membership, because the same near-free-premium dynamics that produce non-utilizers also produce volume growth. For an issuer whose 94 AV enrollment skews sicker, the opposite happens: fewer non-utilizers, more HCC+ utilizers, more Hit-OOP exposure. The actuarial case for a higher load to recover the additional unreimbursed CSR is real but runs into the federal scrutiny we discussed in the prior section.
So we have an issuer with a sicker-than-average book in the highest AV CSR variant. Their actual CSR exposure is higher per member. Their actuarial case for a higher load is stronger. Their load looks high to the federal eye: the same federal eye that’s been newly equipped with §154.301(d) and §155.1000 to scrutinize high loads. Their defense is §156.80(d) actuarial justification, and the substance of that defense is the §156.430(c)(2) reconciliation showing the actual CSR amount on the URRT.
This is the part that connects actuarial projections to operational reality (and does, admittedly, lead to a sales pitch). The shortcut methods most issuers have been using to compute CSR amounts may implicitly assume the issuer’s CSR-eligible mix matches the market average. For any issuer whose composition departs from the average, the shortcut is wrong. For a healthier-than-average book it overstates actual CSR (and the issuer gets a windfall that’s hard to explain in the actuarial memo); for a sicker-than-average book it understates (and the issuer’s case for the higher load they need is weaker than it should be).
The healthier-book issuer’s lower load translates directly into a lower silver premium. Price-sensitive consumers (who tend to be lower-risk, because the people with chronic conditions and established provider relationships aren’t focused solely on lowest premium) gravitate to the cheaper plan. This makes the healthier-book issuer’s silver book even healthier. Meanwhile, the sicker-book issuer’s silver plan is the one priced honestly against its underlying risk, but it’s also the one losing those price-sensitive shoppers to the competitor. The book gets sicker. And since the healthier-book issuer’s lower-loaded silver plan ends up being the SLCSP, federal APTC outlay decreases, which widens the out-of-pocket gap consumers face on any plan priced above the benchmark. None of this is unique to NBPP 2027, but the new regulatory regime makes the bad equilibrium harder to escape.
An optimistic reading of these rules is that CMS will use the new data collection to identify issuers whose loads are clearly mispriced relative to the market (especially in states that are not mandating specific CSR loads), and there, the net effect could be to push the market toward more consistent pricing that aligns with the single risk pool principles and reduces the ability for issuers to cherry pick the lowest risk membership. But I admit to being skeptical that this will be the outcome, and if the intended outcome is actually to just reduce APTC expenditures, we should be prepared for an acceleration in the decline of the size of the ACA market.
Why CSR Recon Has to Be Done Right Now
If you’re an issuer with a healthy silver book, you can probably get away with a less precise recon. The distortions work in your favor. An average-uplift shortcut comes close to the right number. The federal regime gives you cover. Your competitor with the sicker book has to do the harder work, and they have to do it before 2027 rate filings, which means the actuals work for plan year 2025 (and the projections for plan year 2027) need to be substantially complete in about a month.
Doing it right is harder than most issuers think, because it effectively requires you to rebuild (or at least document) business logic that may not be widely known outside claims configuration teams. Some quick examples from our experience doing CSR recon:
Take an office visit with a copay of $10 under the CSR variant and $25 under the standard variant. Easy enough, right? It’s $15 in CSR. But what if the doctor did an X-Ray during the visit? Does your claims system apply the office visit copay? Does it apply the X-ray copay? Does it apply both? If set up wrong, the CSR amount can get misstated, and the errors tend to compound.
Or take inpatient stays that apply a copay per day. How do you define a day? Do you include the admission date? The discharge date? Both? If it’s one copay per stay, how do you handle someone who transferred or got readmitted?
Each carrier may have different rules, and they may even vary by plan; I’ve encountered cases where business logic like this depended entirely on what configuration analyst set up the plan.
And then there’s the basic data issues. We encountered a case where the carrier incorrectly mapped the claim number in their pharmacy data - using the Rx number assigned by the pharmacy as the claim number (i.e. the one that gets printed on your prescription bottle). That had the effect of excluding all refills from the readjudication dataset entirely because of how they mapped it as a primary key.
These kinds of issues take time and experience to recognize and clean up, and CMS didn’t give you any grace this go around (Evensun and others asked in our comment letter for such grace, which CMS shot down), which brings me to...
My Shameless Plug
I wrote in last May’s post that a lot of vendors who used to handle CSR reconciliation work exited the space after the 2017 funding cut made the process optional. The market for this work is thin. We’ve been doing it, and I don’t think you’ll find another firm who is more in the weeds than us; we’ve got actuaries, analysts, and CFOs who have all been deep in the trenches of ACA plans, many of us from the very beginning of the ACA. We understand not just the theory, but the nuts and bolts of how claims get processed and what can go wrong.
The right time to start is now. The URRT CSR line items are effective for PY 2027 rate filings, which are due June 10, so the actuals work for the experience period (PY 2025) and the projection for PY 2027 both need to be substantially complete in the next few weeks. If you’re reading this on the day it went up, you have about three weeks. Pricing starts at $100,000 per HIOS ID for up to 100,000 lives with clean data; if the data is messy, the cleaning work goes under a consulting engagement. If you’re already doing the re-adjudication in-house and just want an independent validation pass, we can do that too: same methodology, independent compute, comparison-and-reconciliation report. That’s a lighter lift and useful as a peer-review check or a SOC-2-style independent control evidence trail.
If you’ve got thoughts about what CMS is up to and want to point out where I’m wrong, leave a comment!
Coming up
On an unrelated note, my wife and I are expecting a baby, and we have a scheduled induction next Monday (May 25).10 So, I’ll be taking some time off for parental leave - but Evensun has a fantastic team of folks who will be writing here in my stead. We’re writing these as we go, so we don’t have a specific release schedule or order, so go ahead and subscribe so you don’t miss a thing!
If you want us to take a look at your CSR recon process, reach out to me at wesley@evensun.com and CC Joe Caldwell at joe@evensun.com since I’ll be on leave soon.
There are also separate zero-cost-sharing CSR variants for American Indian and Alaska Native enrollees, available across all metal levels rather than just silver. Enrollment in these variants is low enough that I’m setting them aside for this post; the dynamics described below apply to the standard 73/87/94 AV silver variants for enrollees under 250% FPL.
CMS’s belief here doesn’t match the field experience I’ve seen.
HC.gov states report CSR variant directly; SBE states report only the silver-enrollee FPL distribution. FPL and CSR categories map cleanly, so we can generally assume the following relationship: 100–150% FPL → 94 AV, 150–200% → 87 AV, 200–250% → 73 AV. Comparing the two on HC.gov states where both are reported, the FPL bands track the CSR variant shares within 1–2 percentage points, so we can use FPL as a proxy.
2026 OEP State-Level Public Use File, CMS, March 2026. Two SBE states with Basic Health Programs covering the 100–200% FPL population (New York’s Essential Plan, Minnesota’s MinnesotaCare) effectively have no low-income silver enrollment; for them, the actuarially-correct silver load is near zero. They’re included in the expansion aggregate but pull the average down meaningfully.
Thanks to David Anderson for pointing out an original error in my math. This is enrollment-weighted, not premium-weighted, and assumes the AV calculator’s implied incremental cost shares are correct in aggregate (the actual answer depends on utilization patterns within each CSR variant, which is partly what the IDF is supposed to capture). It also just lazily assumes the AV difference should be a direct input to premium. These assumptions are almost certainly wrong for a lot of reasons, but I think the conclusion is directionally correct.
And who I offer my apologies in advance, as he will almost certainly take umbrage with my use of terms like silver-loading, CSR load, etc.
There are some who argue that this is evidence of significant fraud. I think some of it may be fraud, but a big part of the story is that a lot of members had short enrollment spans and churned mid-year (either to a new issuer or out of the market altogether). This will be a future post.
Methodology and assumptions for the margin estimation: EDGE Limited Data Set (CMS) for benefit years 2022 and 2023, restricted to individual market (market=’1’), Silver metal level, deidentified at the member-key level. Risk scores computed under the 2023 model. Proxy risk-transfer formula uses national rather than state-level weighted averages as the denominators. Within-state variance in the actual margin will exceed what the national proxy shows, both because state-specific premium levels differ and because the transfer formula is calculated at the state-and-market level. Premium proxy is the calibrated plan-adjusted index rate from the 2024 URRT (2022 experience period) and the 2025 URRT (2023 experience period), member-month-weighted, run through the federal age curve to age-adjust per member; this approximation doesn’t include tobacco loads, geographic factors, or actual rating-area-specific silver-loading methodology, and issuer-specific revenue per enrollee will differ from the proxy by something on the order of 5–20% depending on state. It also doesn’t account for state reinsurance, which will make the hit OOP segment almost certainly more profitable. GCF held constant on both sides of the transfer formula. OOP thresholds calculated using an enrollment-weighted average of the out of pocket maximums from plans sold in 2023 on the FFE (SBE data is less consistent). The Hit-OOP segments are identified using cumulative cost-sharing per member from the EDGE data (allowed amount − paid amount summed at the member level); this proxy doesn’t account for out-of-network utilization that doesn’t accrue to the in-network OOP. The aggregate pool figure is approximately correct because non-utilizer and Below-OOP segments dominate by volume. “Non-utilizer” defined as members with zero claims claims for the year; members with capitated PCP encounters where the plan reports capitation but not derived claim records may appear in the non-utilizer count, slightly inflating the 94 AV non-utilizer share. All dollar figures are proxy-based and approximate: directionally correct, but not precision estimates; the methodology is intended for order-of-magnitude policy analysis rather than issuer-specific financial planning.
An article a few years ago on the heteroskedasticity of spending points out the incentive problem this creates; even if risk adjustment were perfect (it’s not), there’s still an incentive to attract the lower risk members because the risk of substantial losses is larger for the chronically ill than the healthy. See Oskam, van Kleef, and Douven, “Heteroscedasticity of residual spending after risk equalization: a potential source of selection incentives in health insurance markets with premium regulation” in the European Journal of Health Economics, https://pubmed.ncbi.nlm.nih.gov/37162689/
Handling newborns is also its own complicated set of problems when doing CSR recon! I’ll be trying not to think about it while I’m off, though.